Florian Krautli is a Swiss designer and developer working in London. He holds a BDes in product design from the Design Academy Eindhoven and a MSc in Cognitive Computing from Goldsmiths, focusing on philosophy of perception and artificial intelligence. He is experienced as a designer, software developer and lecturer and his work has been internationally exhibited and featured in both design and technology centered media. Currently, his research revolves around interactive data visualisations for cultural data, with a focus on representations of time.
Recently, we interviewed him and gained interesting insights in the field of data visualizations concept designing, scroll down and see for yourself,

TechieTonics: How has your journey been from concept designing to data visualization? How are you able to achieve a balance between form and function to communicate information, the beauty of data visualization?
Florian: I’m not sure if I already count as a digital native, but I did in fact come in touch with digital technology very early and therefore it always played a crucial role in my design process. I think what’s intriguing in data visualisation for a designer is that data can act as a material. And it’s attractive to work with it because there is an abundance of material freely available, not the least because it is immaterial.
TechieTonics: Human Antenna, one of the most innovative and interesting concept, would you please elaborate on it, am sure readers would find it engaging too.
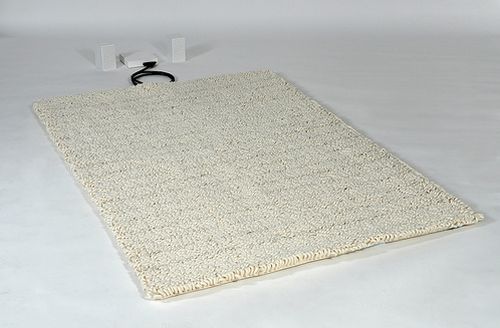
Florian: Human Antenna originated from a line of thought that also produced the Magnetic Curtain and is rooted in Tony Dunne’s seminal book ‘Hertzian Tales’. The book explores the omnipresence of electric fields in our surrounding. I wondered how our interiors might look, if not visible light, but the invisible part of the electromagnetic spectrum would be our main concern.
Human Antenna is a carpet that acts as a radio and uses a human body as an antenna. Moving around on the carpet tunes the radio to different frequencies. It’s like moving around in the electromagnetic radio space.
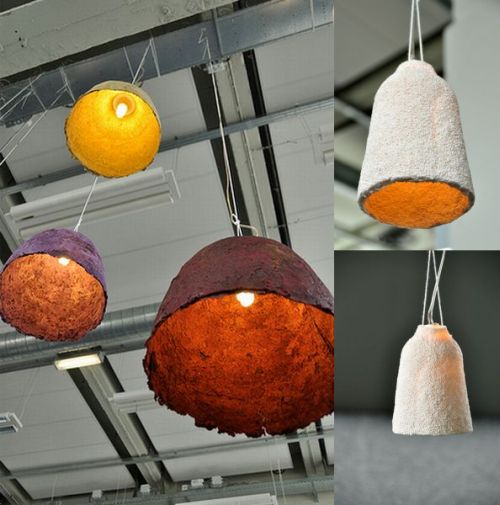
TechieTonics: For the birds, lampshades from tapioca, vegetables and wafers, wow! that is one of the most fascinating thing I have ever heard or read. Who/what is the inspiration behind this concept of yours? And what about its feasibility?
Florian: This project was often connected with some kind of green/sustainable thinking behind it. However, this was not my intention. It’s actually a reflection on the concept of ownership. Often people would put furniture pieces they don’t want anymore on the street for anyone to take or – if nobody wants them – to be disposed. When objects that are clearly intended for indoor use are put outdoors, they are seen as not having an owner; the change of context makes them public goods. The ‘For the birds’ lampshades are designed specifically with this change in mind and with the – for some designers inconceivable – reality, that people eventually will get tired of things or have no use for them anymore. When the lampshades are put outside, they are not furniture anymore, but food. They are not owned anymore but free for anyone or any animal to take/eat.
TechieTonics: Vibrative virtual invisible keyboard, app that translates vibrations from different surfaces caused by tapping, how far did it reach the production level?
Florian: It is still very experimental. In order for it to be usable the recognition of individual keys has to be almost perfect, otherwise it is very frustrating to use. The main problem is that with only one accelerometer, it is very difficult to exactly determine the location of a tap. With two it would be much easier. I don’t know if any smartphone already has two accelerometers built in, but who knows. The new iPhone already has a dedicated chip for recognising motion, so I think these kinds of sensors will find more uses in the near future.
TechieTonics: If we talk about data visualization, will the new and advanced database technologies change the way of our understanding relationships in the data?
Florian: I think our relationship to data already changed a lot in the past years, not the least through some political scandals. Data visualisation can certainly play an important role here, because it is very difficult to really relate to the concept of ‘data’ and understand the true relevance of it, without having something visual.
TechieTonics: Will the upsurge of data with the open data movement improve people’s visualization literacy? If yes, how far will the ripples go?
Florian: I think it will. Visualisation is a great way for people to access and play with data, without necessarily having an understanding of databases and query languages. As both the data and the tools are freely available, basically anyone can engage in it and a lot of people do. It’s hard to say how far it’ll ripple. It can go anywhere from being a current trend to being taught in schools. Of course, I would hope for the latter.
TechieTonics: Morphing data into chart or infographic, thinking that it well become a story is not enough, there’s a lot more things that go into harvesting information from the world of data. How far am I correct in holding the view?
Florian: Very correct. Probably a good overview is the Data Journalism Handbook. Journalism and information visualisation, whether based on digital data or other sources, involves crafting a narrative. The data (which can be true or false or any shades in between) is only the starting material.
TechieTonics: If it’s not difficult can you please tell us something about the thought process involved during data analysis during visualization technique?
Florian: I try to get an overview of the dataset first. I do this by simply looking at the data and see how it is structured (what information it might be able to hold) and find out what I might want to know about it. I’ll also try to visualise some aspects in order to get a sense of the distributions and emphasis in the dataset. Then it is usually a process of going back and forth between visualisation and examination and quite a lot of data cleaning and restructuring. Manipulating the dataset in this way is like looking at it from different viewpoints. Some things or correlations might only become visible from a certain perspective.
TechieTonics: What tools would you recommend for people to access for creating data visualizations?
Florian: A great tool is Google Refine (although it’s now not Google anymore but developed independently). It’s a tool for cleaning data, which is absolutely essential. Most datasets are incredibly messy. Further, the best tool is what one is comfortable with. Excel is not a bad starting point. D3.js is amazing too, but it requires some knowledge of JavaScript and it takes some time to get used to the syntax.
TechieTonics: Before wrapping up would you like to share something with our readers?
Florian: That’s all for now! But feel free to follow me at @fkraeutli

Quick bits:
TechieTonics: Proudest career moment?
Florian: I didn’t realise I had a career?
TechieTonics: Latest obsession?
Florian: Attending obscure academic conferences
TechieTonics: Lace up or loafer?
Florian: Camper Peu, best of both
TechieTonics: Most versatile color?
Florian: #000000
Thank you Florian for sparing time for the interview, we really appreciate that. Before wrapping up we’d like to wish you success for your research and other future endeavors.